How Do You Calculate Employee Turnover Rate?
· 8 min read
You calculate employee turnover rate by dividing separations for the period by average headcount, then multiplying by 100, where average headcount is (starting headcount + ending headcount) / 2. A team that starts a quarter at 190, ends at 210, and loses 22 people posts 22 / 200 x 100, an 11% quarterly rate. Read the result against your sector: contact-center attrition runs 30-45% a year versus a ~22% cross-industry average, and roughly half of frontline leavers quit inside 90 days, so segment the 90-day rate before acting.
Turnover rate calculator
Calculate your turnover rate
Enter your headcount and separations to get your turnover rate, annualized rate, 90-day attrition, and how it reads against industry benchmarks.
Annualized rate multiplies a clean quarter x4 or month x12.
Voluntary quits + involuntary terminations + retirements. Internal transfers don't count.
Your result
Your annualized rate of 25.0% is above the ~22% cross-industry average. With 30.0% of new hires lost inside 90 days, most of this churn is a screening problem, not a pay problem. ZenHire screens for fit and reliability before the offer.
The turnover rate formula+
- 1.Average headcount = (headcount at start + headcount at end) / 2. Using a single snapshot instead skews the rate while you grow or shrink.
- 2.Turnover rate = separations / average headcount x 100. Separations are everyone who left in the period; internal transfers are not separations.
- 3.Annualize a clean quarter or month by multiplying by 4 or 12, but only when churn is steady, since seasonal spikes make that shortcut lie.
- 4.90-day attrition = separations in the first 90 days / hires in the period x 100: the leading indicator that mostly reflects screening quality.
What is the employee turnover rate formula?
The employee turnover rate formula is the number of separations divided by average headcount, multiplied by 100. Separations are everyone who left during the period: voluntary quits, involuntary terminations, and retirements. Average headcount is your midpoint staffing, calculated as the headcount at the start of the period plus the headcount at the end, divided by two. The result is the percentage of your workforce that turned over.
The single most common mistake is in the denominator. Teams divide by their current headcount instead of the average, which skews the rate whenever the company is growing, shrinking, or staffing up for a season. If you start the year with 100 people, end with 140, and 30 left along the way, your average headcount is 120, so your turnover rate is 30 / 120 x 100 = 25%, not the 21% you would get by dividing against the end-of-year 140. Same departures, different story, because of how you counted heads.
An edge case worth flagging: backfills and internal transfers. If you replace a leaver and the replacement also quits within the period, that is two separations against the same seat, and both count. But a person who moves to another department internally is usually not a separation at all. Decide your rules once and apply them everywhere, or your trend line will measure your bookkeeping instead of your retention. The same discipline that powers good recruitment metrics applies here: a number is only useful when it is defined consistently over time.
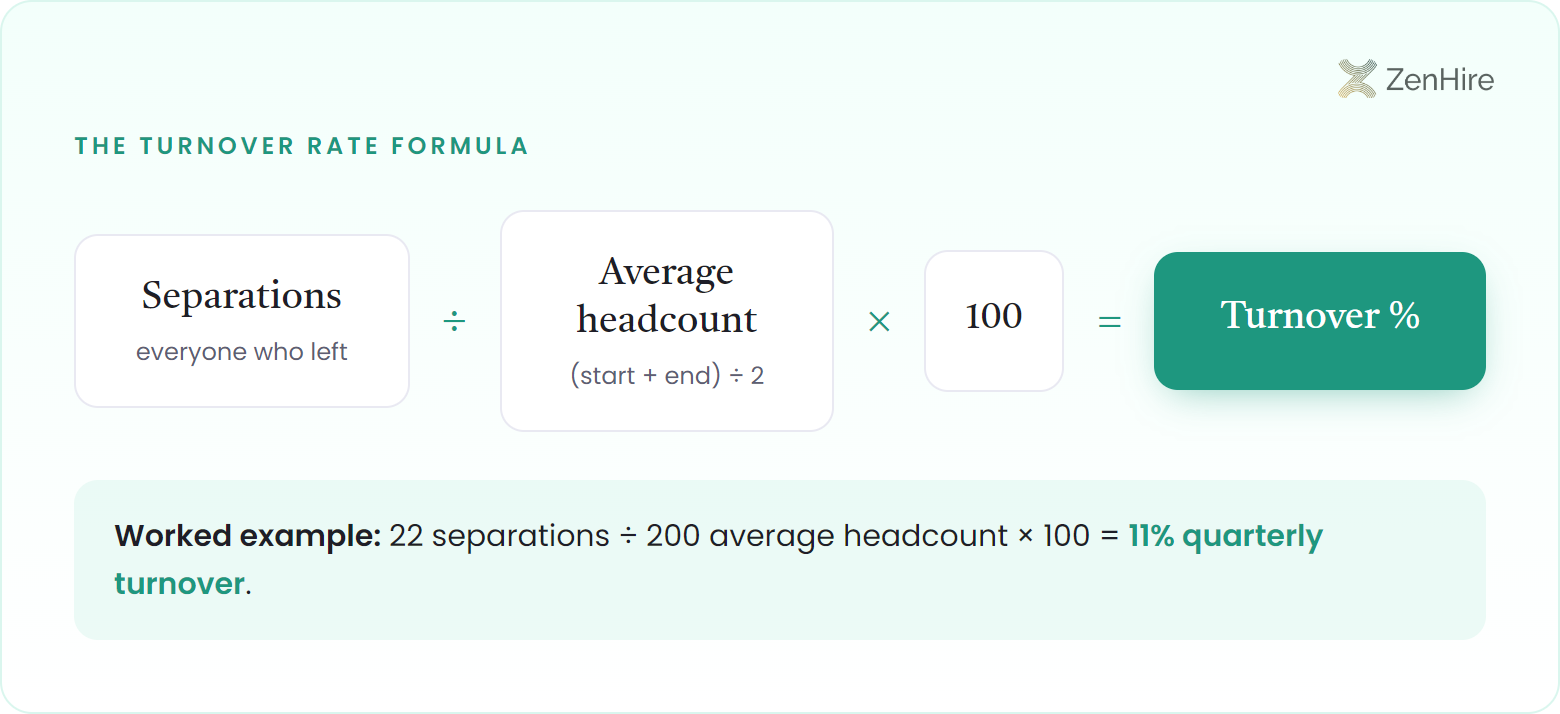
Worked example: a 200-person operation that began the quarter at 190 and ended at 210 had 22 people leave. Average headcount is (190 + 210) / 2 = 200, so the quarterly turnover rate is 22 / 200 x 100 = 11%. Annualize a clean quarter by multiplying by four (~44%) only if churn is steady; seasonal spikes make that shortcut lie.
- Separations: everyone who left in the period (voluntary, involuntary, retirement)
- Average headcount: (headcount at start + headcount at end) / 2
- Turnover rate: separations / average headcount x 100
- Pick one period and hold it: monthly, quarterly, or annual, but compare like with like
How do you read your turnover rate result?
You read your turnover rate result by segmenting it, because a single blended number tells you almost nothing actionable. The headline rate answers "how much," but the useful questions are "who, when, and from where." Split the number into voluntary versus involuntary, by role and location, by tenure band, and by hiring source. Each cut points at a different lever.
The most revealing cut is by tenure, specifically the 90-day rate, the share of new hires who leave inside three months. It is a leading indicator that mostly reflects screening quality, and it moves months before your annual rate does. Consider two teams that both post 30% annual turnover: one loses long-tenured people to better offers, the other loses brand-new hires before training pays back. The annual number is identical; the problem (and the fix) could not be more different. Reading quality-of-hire alongside the rate keeps you from celebrating a low number that hides a quietly worsening pipeline.
An edge case that trips people up: a low turnover rate is not automatically good. In a struggling team, zero exits can mean disengaged people who feel stuck, not happy people who chose to stay, and a single layoff can spike the rate without telling you anything about voluntary retention. That is why you separate voluntary from involuntary before drawing any conclusion. The same logic underpins cost-per-hire: a metric only earns its keep when you can trace it back to a decision you can change.

The cut that pays for itself is the 90-day rate. With roughly half of frontline leavers gone inside their first 90 days, before the 4-6 months it takes to reach full proficiency, early attrition is the most expensive churn you have. You paid to hire, paid to train, and now pay to do it again before the first investment returned a cent.
What are healthy turnover rate benchmarks?
Healthy turnover rate benchmarks are industry-specific; there is no universal "good" number. What counts as alarming in a corporate office is routine on a contact-center floor. Comparing your rate to the wrong benchmark leads to the wrong panic or the wrong complacency, so anchor against your own sector and, ideally, against your own historical trend.
Frontline and high-volume roles sit at the high end by nature. Contact-center attrition commonly runs 30-45% a year, roughly two to five times higher than the cross-industry average near 22%, because the work is demanding, the labor market is liquid, and many of those exits cluster in the first 90 days. A 35% annual rate that would terrify a law firm is simply Tuesday for a BPO hiring team. The honest benchmark is rarely an absolute threshold; it is the direction your own segmented rate is trending quarter over quarter.
An edge case to watch: a benchmark can flatter a broken process. If your sector average is 40% and you post 38%, you might call that healthy, yet if 30 of those points are 90-day quits driven by inconsistent screening, you are normalizing a fixable loss. The benchmark says you are average; the segmentation says you are leaving money on the table. The most reliable way to push your rate below the benchmark is to hire for fit and reliability up front, which is exactly what structured interviews and validated assessments are built to do.
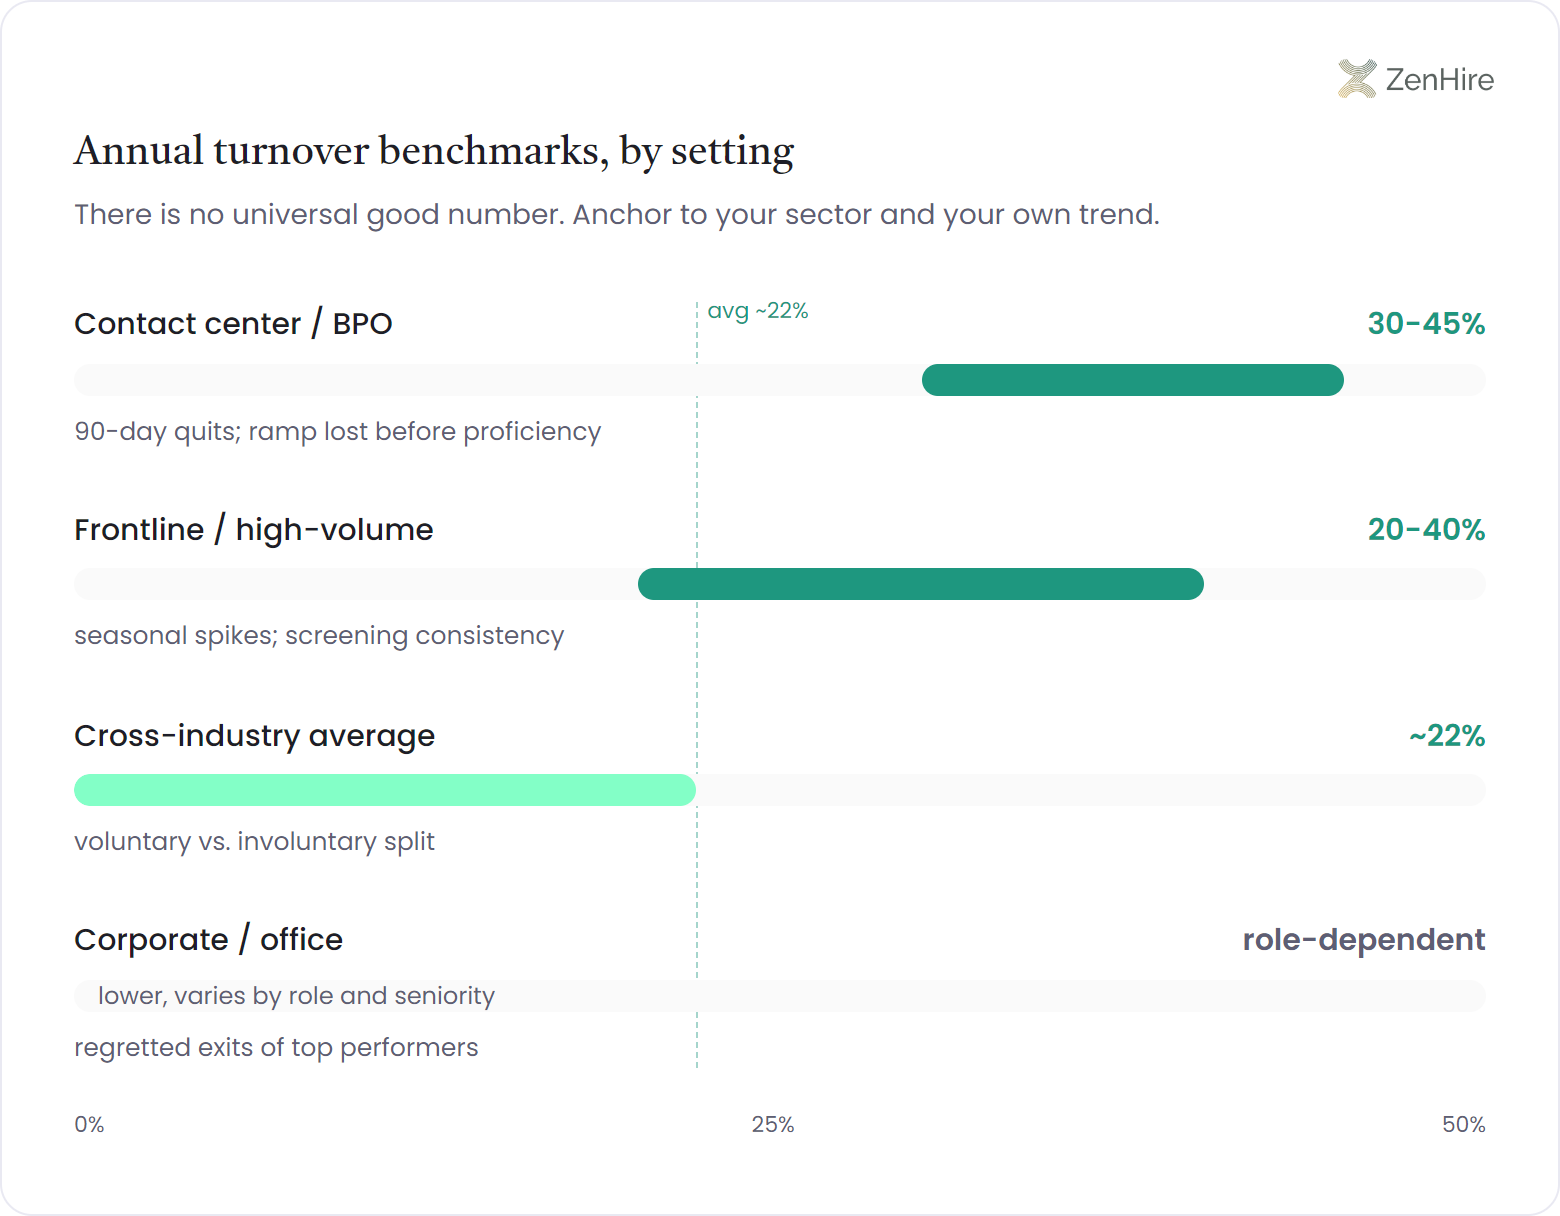
| Setting | Typical annual turnover | What to watch |
|---|---|---|
| Contact center / BPO | 30-45% | 90-day quits; ramp lost before proficiency |
| Frontline / high-volume | 20-40% | Seasonal spikes; screening consistency |
| Cross-industry average | ~22% | Voluntary vs. involuntary split |
| Corporate / office | Lower, role-dependent | Regretted exits of top performers |

People come to me wanting the magic number: "Vladimir, what turnover rate should I aim for?" Wrong question. The rate is a thermometer, not a diagnosis. I would rather you split that one number into ten honest ones, because the day you separate your 90-day rate from your annual rate is the day you stop arguing about pay and start fixing your screen. Almost every alarming turnover chart I have seen turned out to be a hiring chart wearing a disguise.
Frequently asked questions
What is the formula to calculate employee turnover rate?+
The turnover rate formula is separations divided by average headcount, multiplied by 100. Count everyone who left during the period, divide by your midpoint headcount, (start + end) / 2, and the result is the percentage of your workforce that turned over.
How do I calculate average headcount?+
Average headcount is the headcount at the start of the period plus the headcount at the end, divided by two. Using a single snapshot instead skews the rate whenever you are growing, shrinking, or staffing for a season, and the same departures can read as 21% or 25% depending on which number you divide by.
What period should I use to calculate turnover?+
Use whichever period you can compare consistently: monthly, quarterly, or annual. Annual is the standard for benchmarking; monthly or 90-day rates catch problems earlier. The rule that matters is comparing like with like, so you measure retention rather than your accounting calendar.
What is a good employee turnover rate?+
A good turnover rate is industry-specific, not a universal number. Frontline and contact-center roles routinely run 30-45% a year against a cross-industry average near 22%, so anchor to your sector and your own trend. The more useful target is a falling 90-day rate, segmented by role and hiring source.
Why is my turnover rate high even though pay is competitive?+
A high turnover rate with competitive pay usually points to a screening problem, not a pay problem. When roughly half of frontline leavers are gone within 90 days, the issue is fit and reliability caught too late, which is why reducing turnover starts at the hire, not the offer.
Free for calculating turnover rate
The turnover rate calculator template
A plug-and-play sheet that runs the formula correctly, with average headcount handled, voluntary and 90-day rates broken out, and benchmarks by industry so you read the result, not just compute it.